- English (UK)
- English (India)
- English (Canada)
- English (Australia)
- English (South Africa)
- English (Philippines)
- English (Nigeria)
- Deutsch
- Español (España)
- Español (México)
- Français
- Italiano
- Nederlands
- Polski
- Português (Portugal)
- Português (Brasil)
- Русский
- Türkçe
- العربية
- Ελληνικά
- Svenska
- Suomi
- עברית
- 日本語
- 한국어
- 简体中文
- 繁體中文
- Bahasa Indonesia
- Bahasa Melayu
- ไทย
- Tiếng Việt
- हिंदी
NFI Group Inc (NFI)
NFI Group Inc stock price live, this page displays TSX NFI stock exchange data. View the NFI premarket stock price ahead of the market session or assess the after hours quote. Monitor the latest movements within the NFI Group Inc real time stock price chart below.
What Is the NFI Group Inc Stock Price Today?
The NFI Group Inc stock price today is 19.70.
What Is the Stock Symbol for NFI Group Inc?
The stock ticker symbol for NFI Group Inc is NFI.
Is NFI the Same as $NFI?
$NFI is a common way to refer to the NFI Group Inc ticker symbol in social media, forums, and online discussions. The dollar sign is a shorthand convention used to indicate that it is a stock ticker symbol
What Stock Exchange Does NFI Group Inc Trade On?
NFI Group Inc is listed and trades on the Toronto stock exchange.
Is NFI Group Inc a Good Stock to Buy?
Determining whether NFI Group Inc—or any stock—is a good buy requires comprehensive analysis. To evaluate its potential, users can sign up to InvestingPro, where they can assess the current NFI Group Inc share price compared with the fair value and other essential metrics.
You can find more details by visiting the additional pages to view historical data, charts, latest news, analysis or visit the forum to view opinions on the NFI quote. (ISIN: CA62910L1022)
19.70
-0.80(-3.90%)
Closed·
Fair Value
An estimate of a stock's true price based on valuation models like discounted cash flow, peer valuation multiples, and dividend discount models.
Day's Range
19.21
20.50
52 wk Range
10.96
20.89
NFI is not included in our AI-picked strategies. See which stocks are.
Fair Value
An estimate of a stock's true price based on valuation models like discounted cash flow, peer valuation multiples, and dividend discount models.
Day's Range
19.2120.50
52 wk Range
10.9620.89
Key Statistics
Edit
Prev. Close
Open
Volume
Average Vol. (3m)
1-Year Change
Fair Value
Fair Value Upside
Market Cap
Shares Outstanding
Revenue
Net Income
EPS
EPS Growth Forecast
Next Earnings Date
N/A
(N/A)
Dividends Payment Streak
P/E Ratio
Return on Assets
Return on Equity
Gross Profit Margin
Price/Book
EBITDA
EV/EBITDA
Beta
Book Value / Share
NFI Scorecard
Company’s Health
Assesses a company's financial position by analyzing its market value, financial ratios, industry benchmarks, and competitors.
UnlockFair Value
An estimate of a stock's true price based on valuation models like discounted cash flow, peer valuation multiples, and dividend discount models.
Unlock PriceTechnical Analysis
Strong Buy
Price Target
23.39
Upside
+18.76%
Members' Sentiments
Bearish
Bullish
ProTips
Tips that distill complex financial data into concise, actionable investment insights.
Significant return over the last week
Technical Analysis
Summary
Strong Sell
Sell
Neutral
Buy
Strong Buy
Sell
Technical Indicators
Strong Sell
Moving Averages
Neutral
NFI Group Inc., together with its subsidiaries, manufactures and sells buses in North America, the United Kingdom, rest of Europe, and the Asia Pacific. It operates through Manufacturing Operations and Aftermarket Operations segments. The Manufacturing Operations segment designs, manufactures, services, and supports transit buses, motor coaches, medium-duty, and cutaway buses; the installation of infrastructure for electric vehicles; and the third-party sales of fiberglass reinforced polymer components. The Aftermarket Operations segment engages in the sale of aftermarket parts and services for transit buses, coaches, and medium-duty/cutaway buses. In addition, the company offers heavy-duty transit buses under the New Flyer brand name; single and double-deck buses under the and Alexander Dennis brand; motor coaches under he MCI brand name; and low-floor cutaway, and medium-duty buses under the ARBOC brand, as well as sells aftermarket parts under the NFI Parts brand. It also engages in infrastructure solutions, connected vehicles and diagnostics, and aftermarket, warranty, and service. NFI Group Inc. was founded in 1895 and is headquartered in Winnipeg, Canada.
NFI Group Inc Earnings Call Summary for Q4/2025
- NFI Group Q4 2025 EPS of $0.50 beat forecasts by 71.88%; revenue of $1.03B missed estimates by 3.74%, rising 22.5% YoY.
- Adjusted net earnings reached $59.6M, up 45.7% YoY; liquidity improved $319M year-over-year with stronger leverage ratios.
- Stock surged 11.39% post-earnings; analyst price targets range $15.44-$19.76, suggesting upside from current $1.03B market cap.
- Company projects continued EPS and revenue growth, driven by electric vehicle segment expansion and manufacturing investments.
- Challenges include UK market competition, supply chain disruptions, tariff impacts, and ongoing battery recall settlement issues.
Last Updated: 03/12/2026, 09:45 AM
Read Full TranscriptNFI Group investor slides for Q4/2025
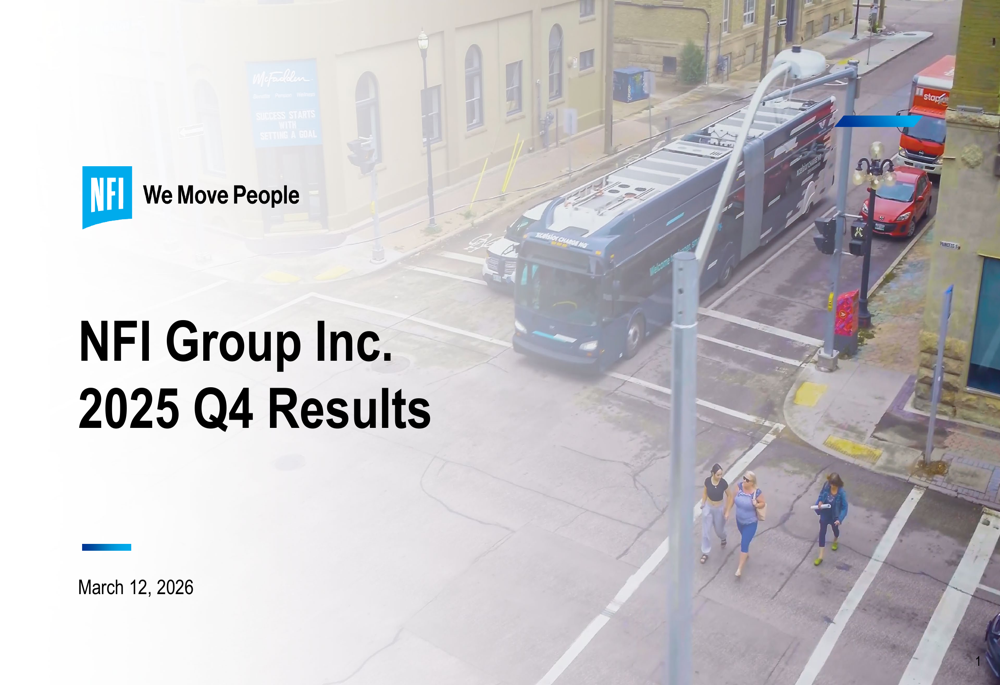
Last Update: Mar 12, 2026
See full investor slides
Compare NFI to Peers and Sector
Metrics to compare | NFI | Sector Sector - Average of metrics from a broad group of related Industrials sector companies | Relationship RelationshipNFIPeersSector | |
|---|---|---|---|---|
P/E Ratio | −11.9x | −0.2x | 12.5x | |
PEG Ratio | 0.00 | 0.11 | 0.03 | |
Price / Book | 2.9x | 1.0x | 1.4x | |
Price / LTM Sales | 0.5x | 0.6x | 1.3x | |
Upside (Analyst Target) | 13.3% | 104.7% | 19.8% | |
Fair Value Upside | Unlock | 21.3% | 5.9% | Unlock |
Analyst Ratings
7 Buy
0 Hold
0 Sell
Ratings:
7 analysts
Overall Consensus
Buy
Analysts 12-Month Price Target:
Average 23.39
(+18.76% Upside)
Earnings
Latest Release
Mar 11, 2026
EPS / Forecast
0.50 / 0.29
Revenue / Forecast
1.03B / 1.07B
People Also Watch
FAQ
What Is the NFI Group (NFI) Stock Price Today?
The NFI Group stock price today is 19.70 CAD.
What Stock Exchange Does NFI Group Trade On?
NFI Group is listed and trades on the Toronto Stock Exchange.
What Is the Stock Symbol for NFI Group?
The stock symbol for NFI Group is "NFI."
What Is the NFI Group Market Cap?
As of today, NFI Group market cap is 1.51B CAD.
What Is NFI Group's Earnings Per Share (TTM)?
The NFI Group EPS (TTM) is -1.19.
When Is the Next NFI Group Earnings Date?
NFI Group will release its next earnings report on May 07, 2026.
From a Technical Analysis Perspective, Is NFI a Buy or Sell?
Based on moving averages and other technical indicators, the daily buy/sell signal is Strong Buy.
How Many Times Has NFI Group Stock Split?
NFI Group has split 1 times.
How Many Employees Does NFI Group Have?
NFI Group has 9000 employees.
What is the current trading status of NFI Group (NFI)?
As of Apr 15, 2026, NFI Group (NFI) is trading at a price of 19.70 CAD, with a previous close of 20.50 CAD. The stock has fluctuated within a day range of 19.21 CAD to 20.50 CAD, while its 52-week range spans from 10.96 CAD to 20.89 CAD.
What Is NFI Group (NFI) Price Target According to Analysts?
The average 12-month price target for NFI Group is 23.39 CAD, with a high estimate of 28.30487469 CAD and a low estimate of 21.26411457 CAD. 7 analysts recommend buying the stock, while 0 suggest selling, leading to an overall rating of Buy. The stock has an +18.76% Upside potential.
Install Our App
Risk Disclosure: Trading in financial instruments and/or cryptocurrencies involves high risks including the risk of losing some, or all, of your investment amount, and may not be suitable for all investors. Prices of cryptocurrencies are extremely volatile and may be affected by external factors such as financial, regulatory or political events. Trading on margin increases the financial risks.
Before deciding to trade in financial instrument or cryptocurrencies you should be fully informed of the risks and costs associated with trading the financial markets, carefully consider your investment objectives, level of experience, and risk appetite, and seek professional advice where needed.
Fusion Media would like to remind you that the data contained in this website is not necessarily real-time nor accurate. The data and prices on the website are not necessarily provided by any market or exchange, but may be provided by market makers, and so prices may not be accurate and may differ from the actual price at any given market, meaning prices are indicative and not appropriate for trading purposes. Fusion Media and any provider of the data contained in this website will not accept liability for any loss or damage as a result of your trading, or your reliance on the information contained within this website.
It is prohibited to use, store, reproduce, display, modify, transmit or distribute the data contained in this website without the explicit prior written permission of Fusion Media and/or the data provider. All intellectual property rights are reserved by the providers and/or the exchange providing the data contained in this website.
Fusion Media may be compensated by the advertisers that appear on the website, based on your interaction with the advertisements or advertisers.
© 2007-2026 - Fusion Media Limited. All Rights Reserved.